Published app monitoring lets you track performance metrics, modify settings, and ensure your published apps run optimally.Documentation Index
Fetch the complete documentation index at: https://docs.replit.com/llms.txt
Use this file to discover all available pages before exploring further.
Features
- Real-time tracking: View published app status, analytics, and configuration details
- Performance analytics: Monitor page views, response times, and user engagement metrics
- App monitoring: Track whether your published app is online, with a colored bar that shows recent uptime at a glance
- Configuration management: Update commands, secrets, and published app options with just a few clicks
Usage
You can access monitoring tools in the Publishing tab.How to access Publishing
How to access Publishing
From the left Tool dock:
- Select
 All tools to see a list of Project Editor tools.
 - Select Publishing
 Publishing.
 - Select Overview at the top.
- Select the
 magnifying glass at the top to open the search tool
 - Type “Publishing” to locate the tool and select it from the results.
- Select Overview at the top.
Overview tab
The Overview tab lets you keep track of your published app’s status and configuration. It provides the following details:- Status: Status of the Replit published app, providing insights into the various stages of the process.
- Domain: URL where you can access your Replit App
- Deployment Type: Autoscale, Reserved VM, Static, or Scheduled
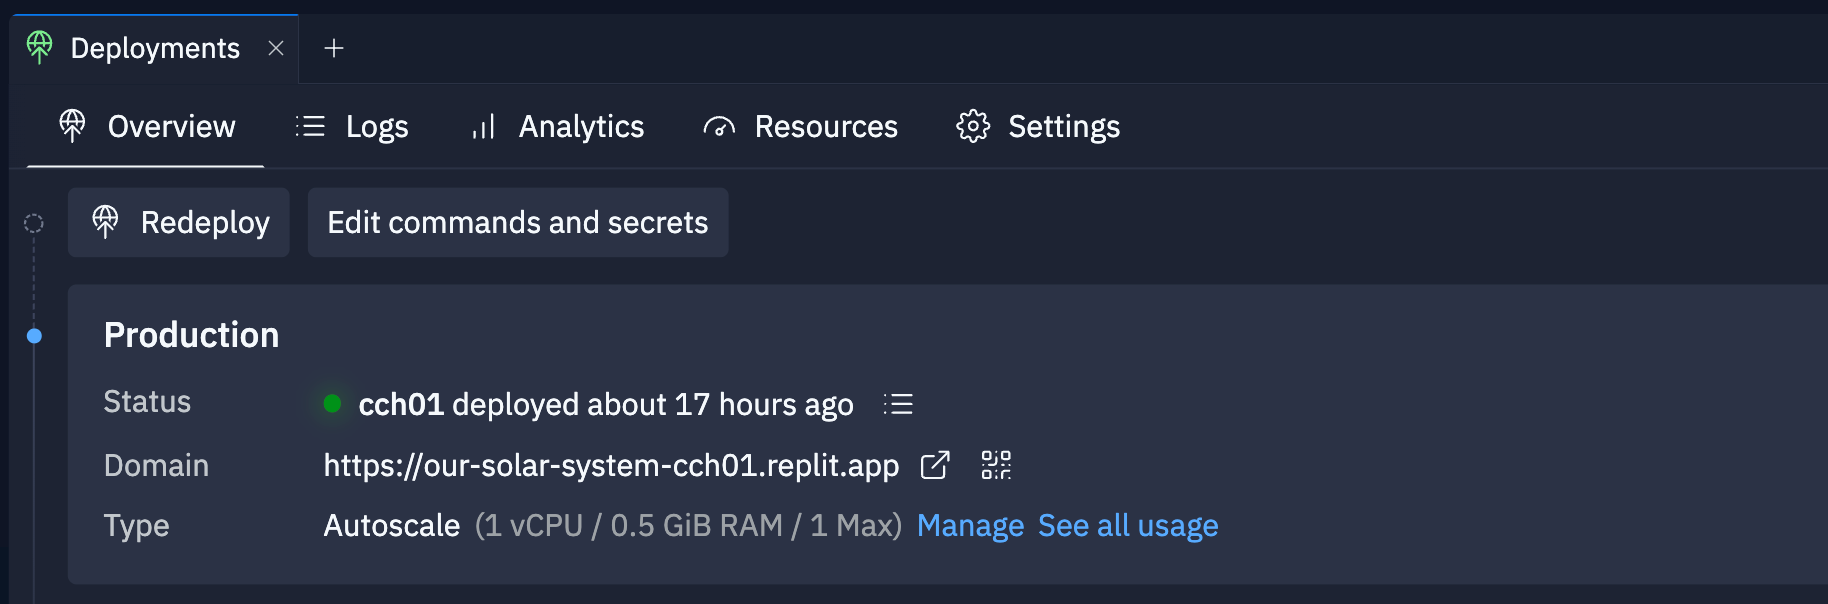
- Republish: Overwrite your current published app with a new snapshot and published app options. You can monitor the status of this published app in this tab.
- Edit Commands and Secrets: Modify the public directory, build command, and published app secrets.
- View publish logs: Access the logs for your published app.
- View published app: Open your published app in a new browser tab.
- QR code: Generate a QR code that you can scan with your mobile device to access the published app.
- Manage: View or update the published app’s settings.
- See all usage: View the Usage billing page.
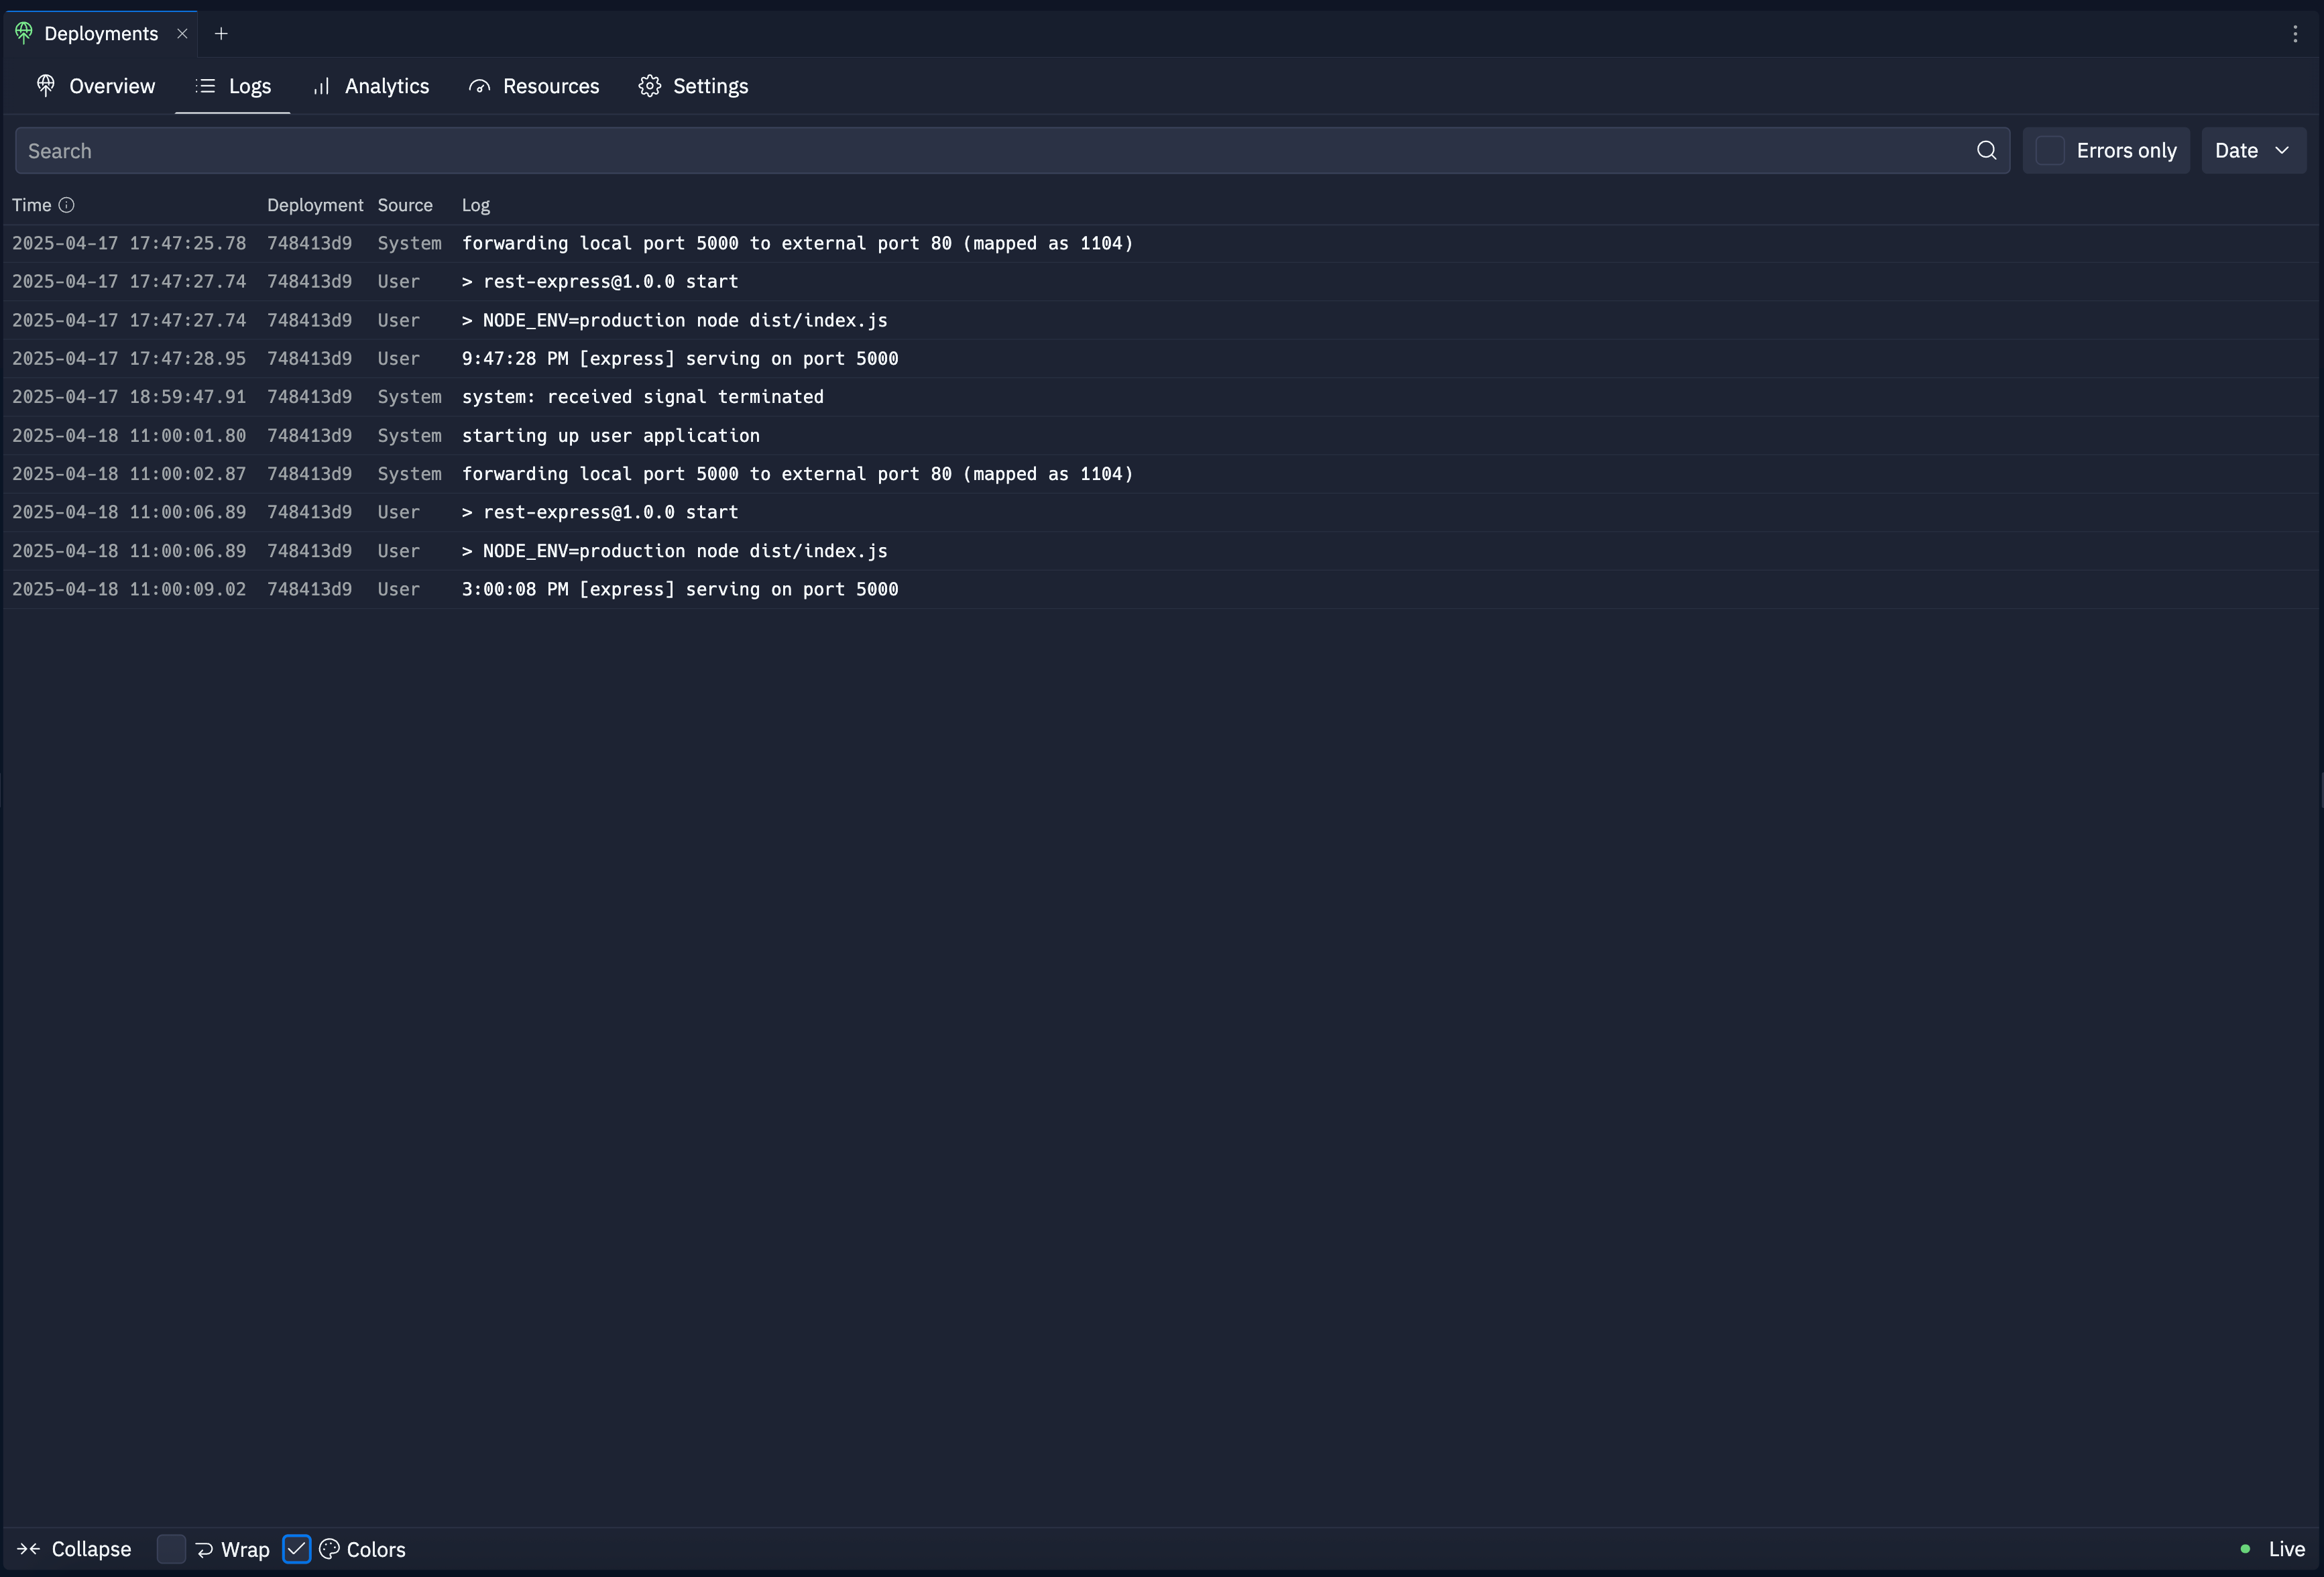
Logs tab
The Logs tab provides real-time logs for your published app. Replit retains logs for 7 days. You can filter logs by the following categories:- Errors only: View only error logs
- Search: Enter a phrase to search for in the logs
- Date: Select a date range
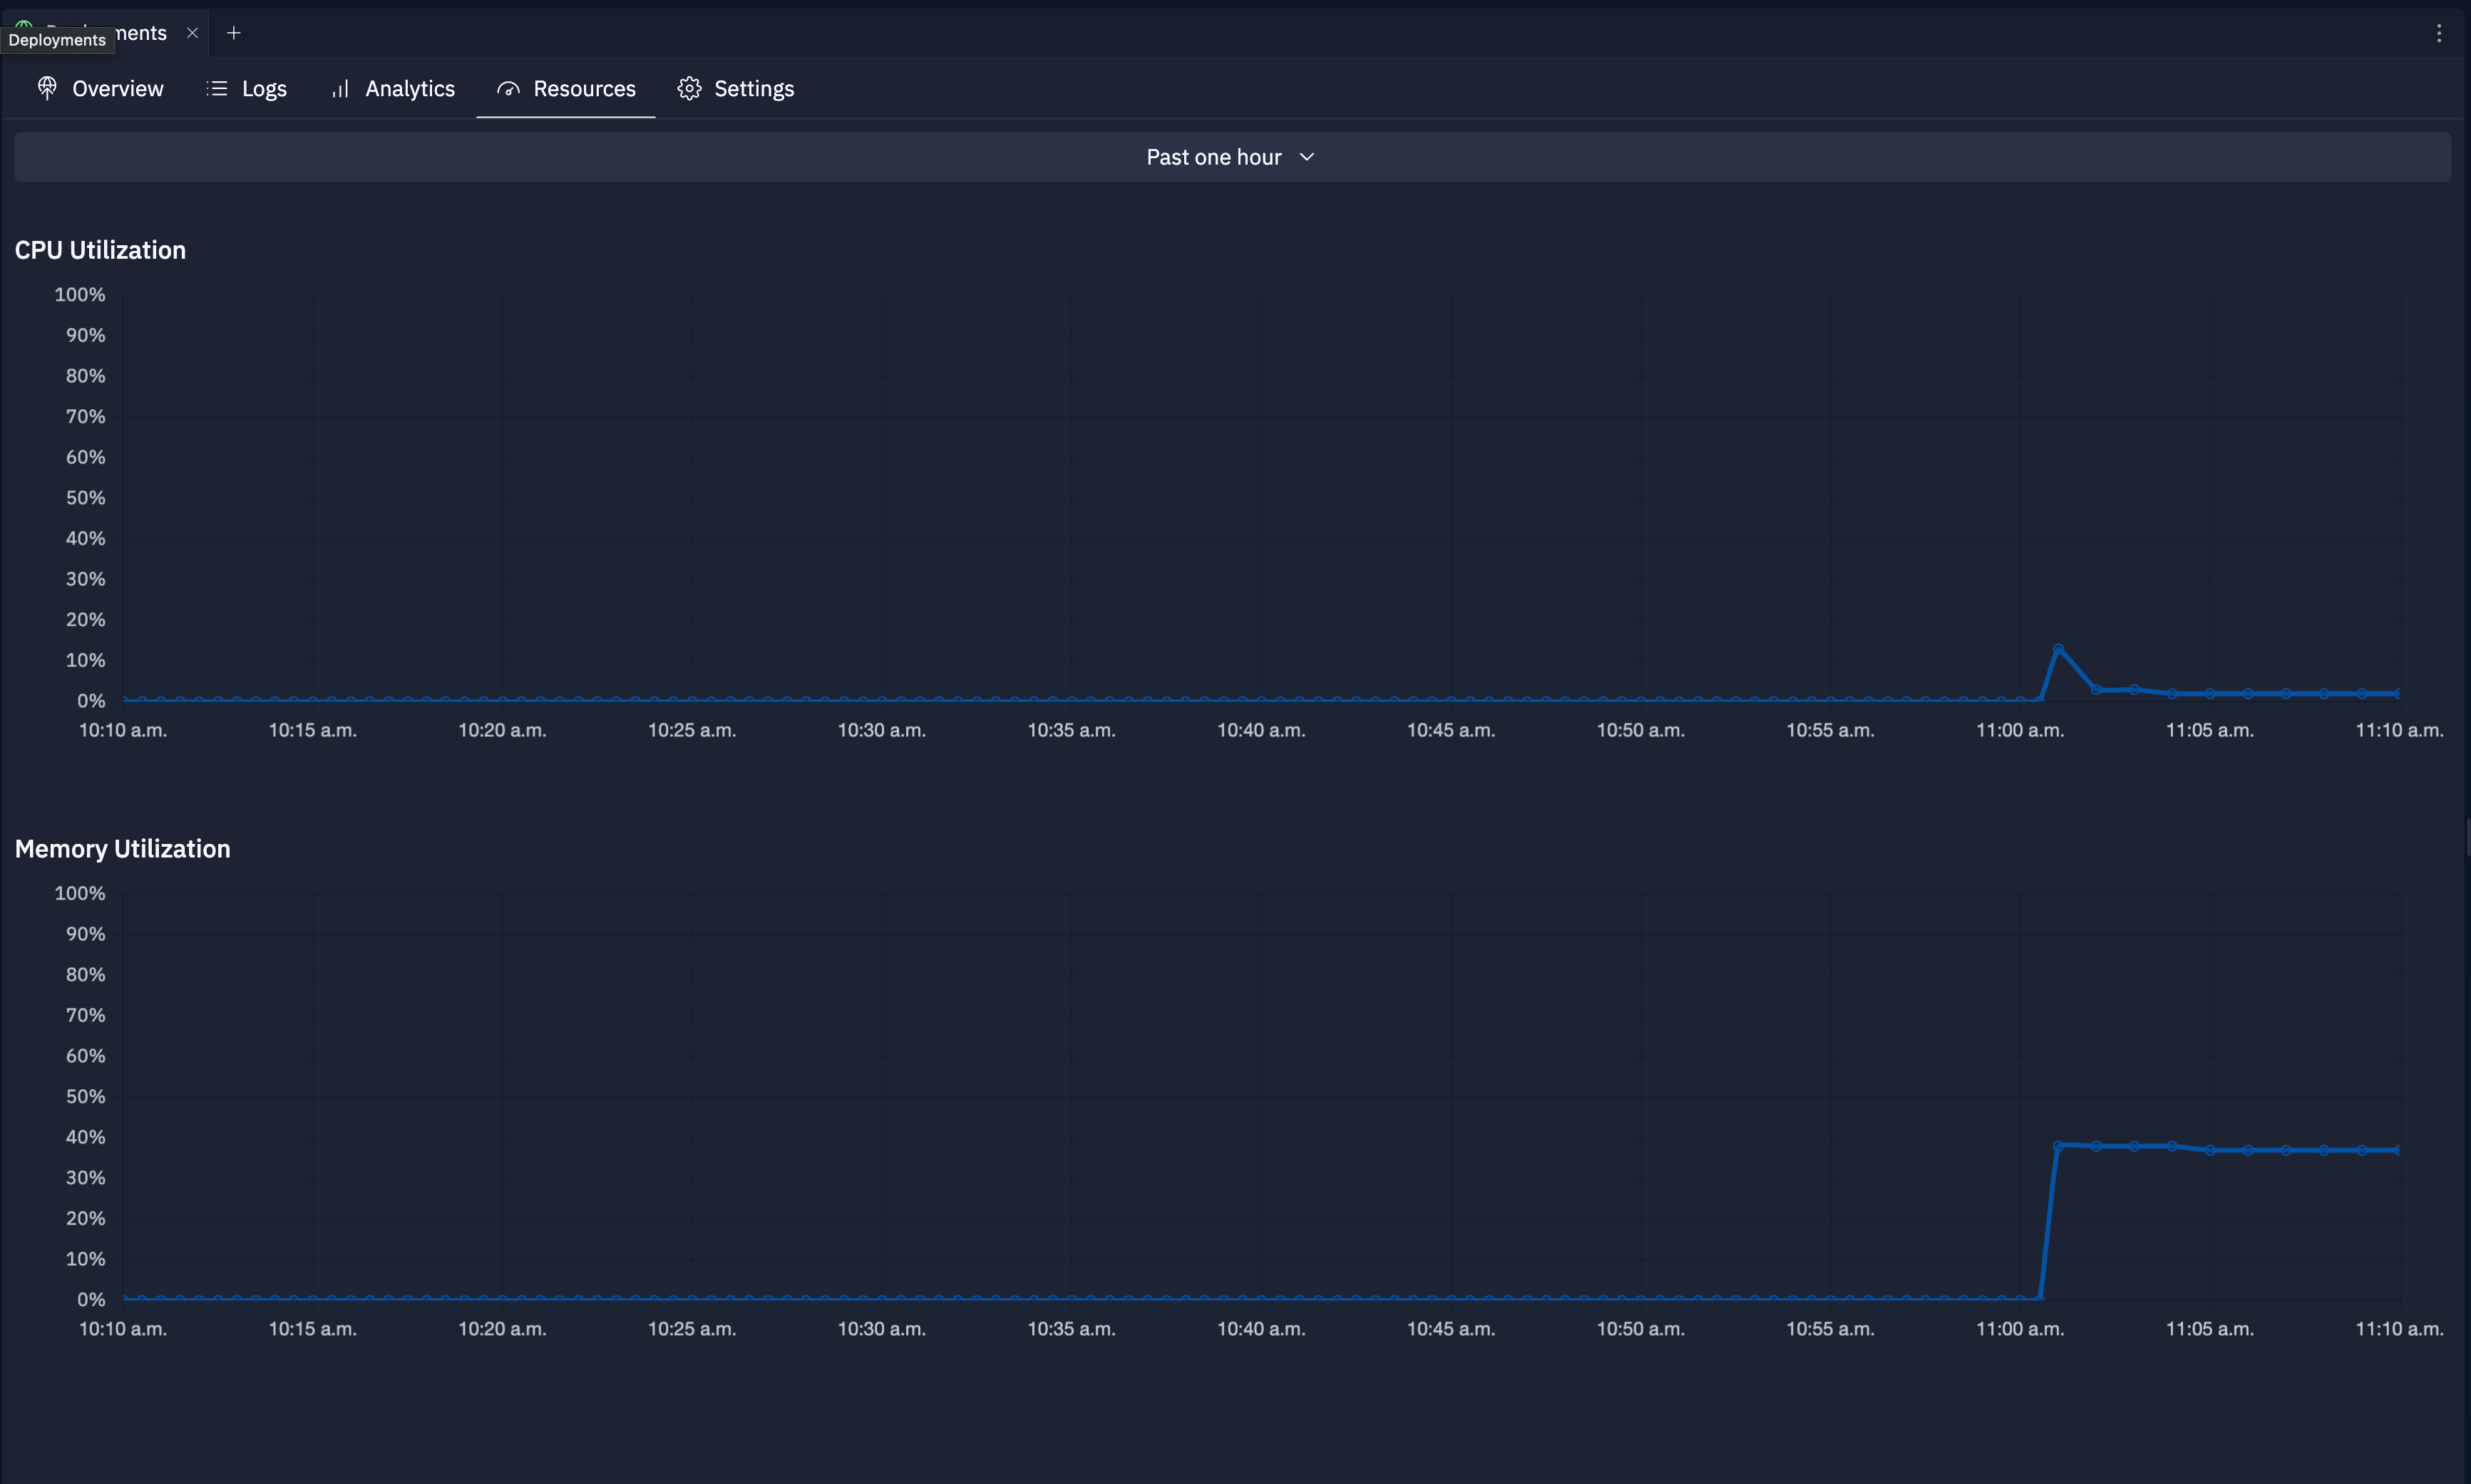
Resources tab
The Resources tab provides a detailed view of your published app’s resource usage. It includes the following information:- CPU Utilization: Percentage of CPU usage over time
- Memory Utilization: Percentage of memory usage over time
Analytics tab
Analytics are available for Autoscale, Static, and Reserved VM Deployments.
- Page Views: Number of HTTP requests your Replit App receives per hour
- Top URLs: Most frequently visited URL paths
- Top Referrers: Traffic sources directing users to your website
- HTTP Statuses: HTTP response codes served by your Replit App
- Request Durations: Server-side load times
- Top Browsers: Browser usage among your users
- Top Devices: Operating systems and devices used to access your Replit App
- Top Countries: Geographic distribution of your users
App monitoring
App monitoring is available on Replit Core, Pro, Teams, and Enterprise plans. It works for all Deployment types except Scheduled Deployments. The Enable app monitoring toggle appears in the publish dialog when your app qualifies.
Turn on app monitoring
You can enable App Monitoring on an existing project from the publish dialog in the Publishing tool.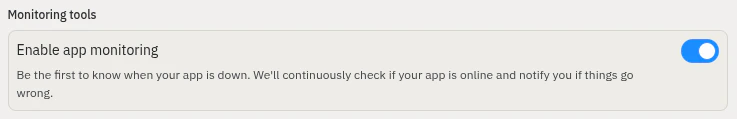
Read your uptime bar
After your app publishes, the Publishing view shows a compact uptime bar alongside your published app’s status, visibility, geography, and Deployment type. Use it to check whether your app is down right now, or whether it had issues recently — for example, overnight while you were asleep.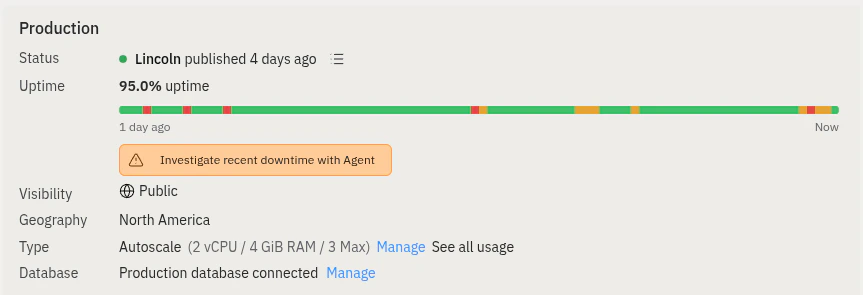
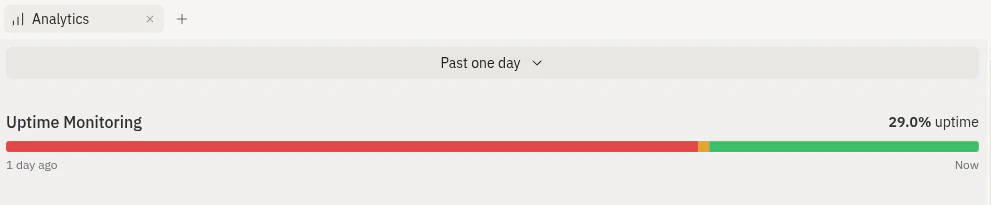
- Green means your app is up.
- Yellow means there are intermittent errors connecting to your app.
- Red means your app is down.
- Gray means no data is available yet for that window.
Investigate downtime with Agent
To dig deeper, select Investigate recent downtime with Agent below the uptime bar. Agent kicks off a new background task, pulls in the affected time windows, and works to identify the root cause — for example, by reviewing logs, code, and database state, then proposing a fix.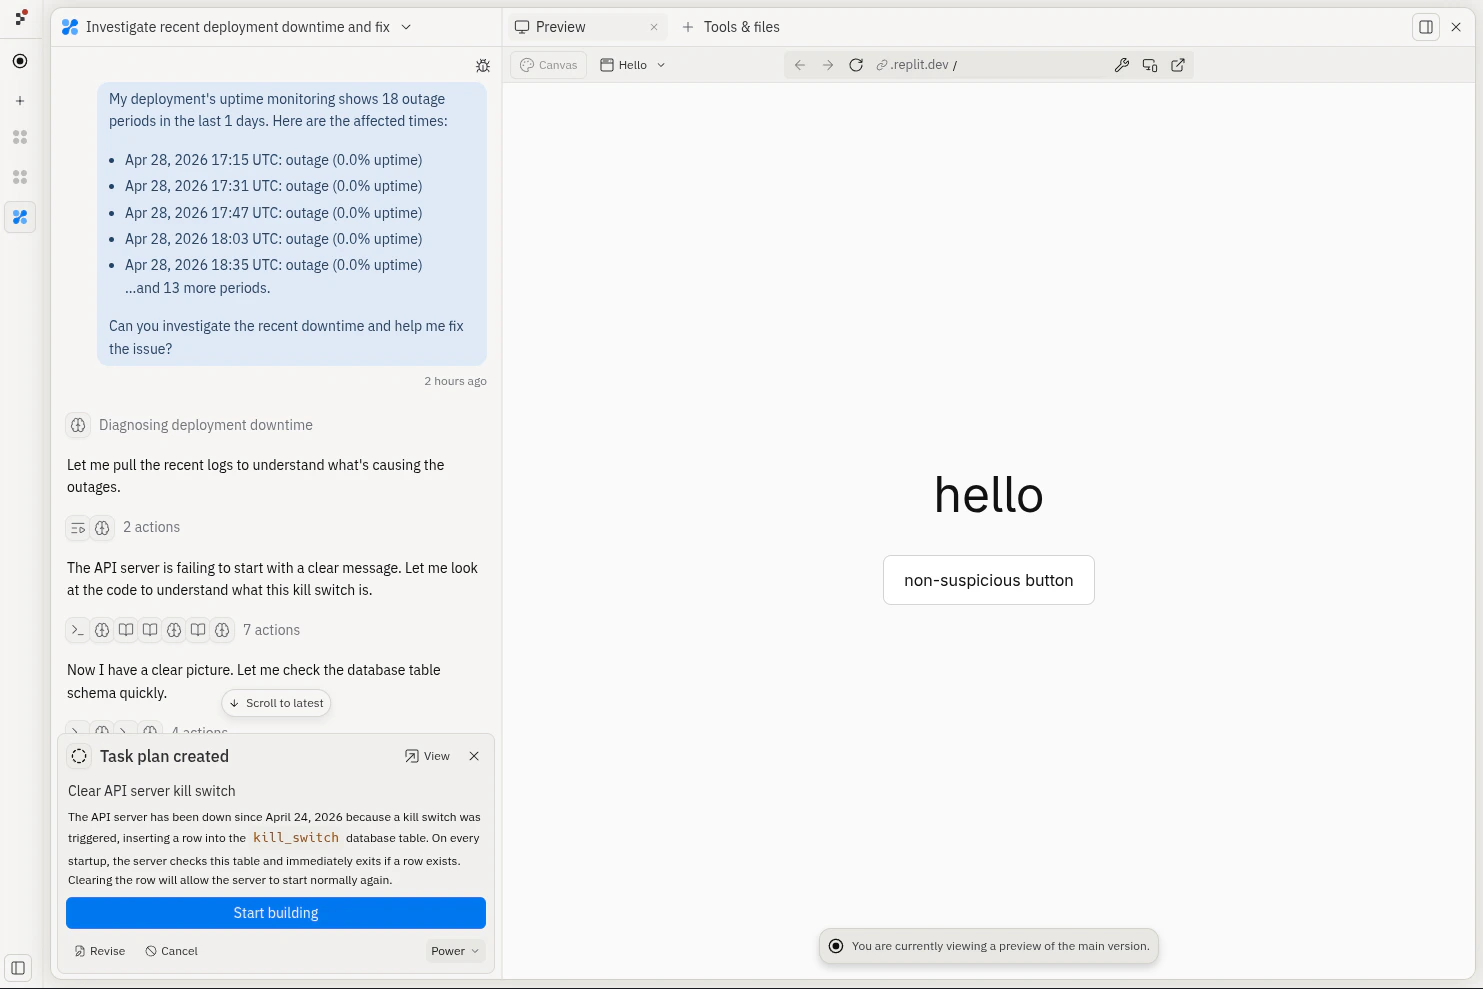
Common causes of downtime
Application downtime is usually caused by one of the following issues:- Your app crashed. Open the Logs tab and look for errors near the time the segment turned red.
- Your app ran out of CPU or memory. Open the Resources tab to check for spikes. If usage was high, choose a larger machine size from the Manage tab.
- A recent publish caused the problem. Compare the timing of red segments to your publish history, then republish a working version if needed.
- Requests were too slow. Long response times can cause checks to fail. Review Request Durations in the Analytics tab.
- A setting is wrong. Expired Secrets, incorrect environment variables, or a database your app can’t reach can take your app offline. Review your configuration in Edit Commands and Secrets on the Overview tab.
Schedule tab
Schedules are available only for Scheduled Deployments.
- Time since the last run
- Date and time the run started
- Amount of time the run took
- Run status
- View logs: Select the
 view logs icon next to the entry to view log messages.
 - Cancel run: Select the
 cancel icon next to the entry to stop a run in progress.
 - Start a run: Select Run Now to manually start a run without altering the schedule.
- Refresh: Use the
 refresh icon to update the run history.
Domains tab
The Domains tab is available for Autoscale, Reserved VM, and Static
Deployments. Scheduled Deployments do not have a Domains tab.
- Link a domain: Connect a custom domain you already own.
- Purchase a domain: Buy a new domain directly through Replit.
- View domain status: See verification status for each connected domain.
Manage tab
The Manage tab includes the following published app configuration settings:- Resource usage: View the machine’s CPU, RAM, and usage cost for your published app.
- Pause: Temporarily stop your published app. This action makes your published app inaccessible, but billing continues.
- Change deployment type: Switch between different Deployment types. For example, if you initially chose Static Deployment, you can change it to reserved VM Deployments.
- Shut Down: Delete your published app and stop its billing cycle. Select Shut down to permanently stop your current published app.
Next steps
- Mobile app: Publish Replit Apps from your mobile device
- Publishing: Learn more about Replit Deployment types
- Publishing costs: View the costs for all Deployment types